Dashboard
The dashboard is the default page of the web portal. It displays statistics about available companies, structures and measurement points. It also serves as a hub for chart display.
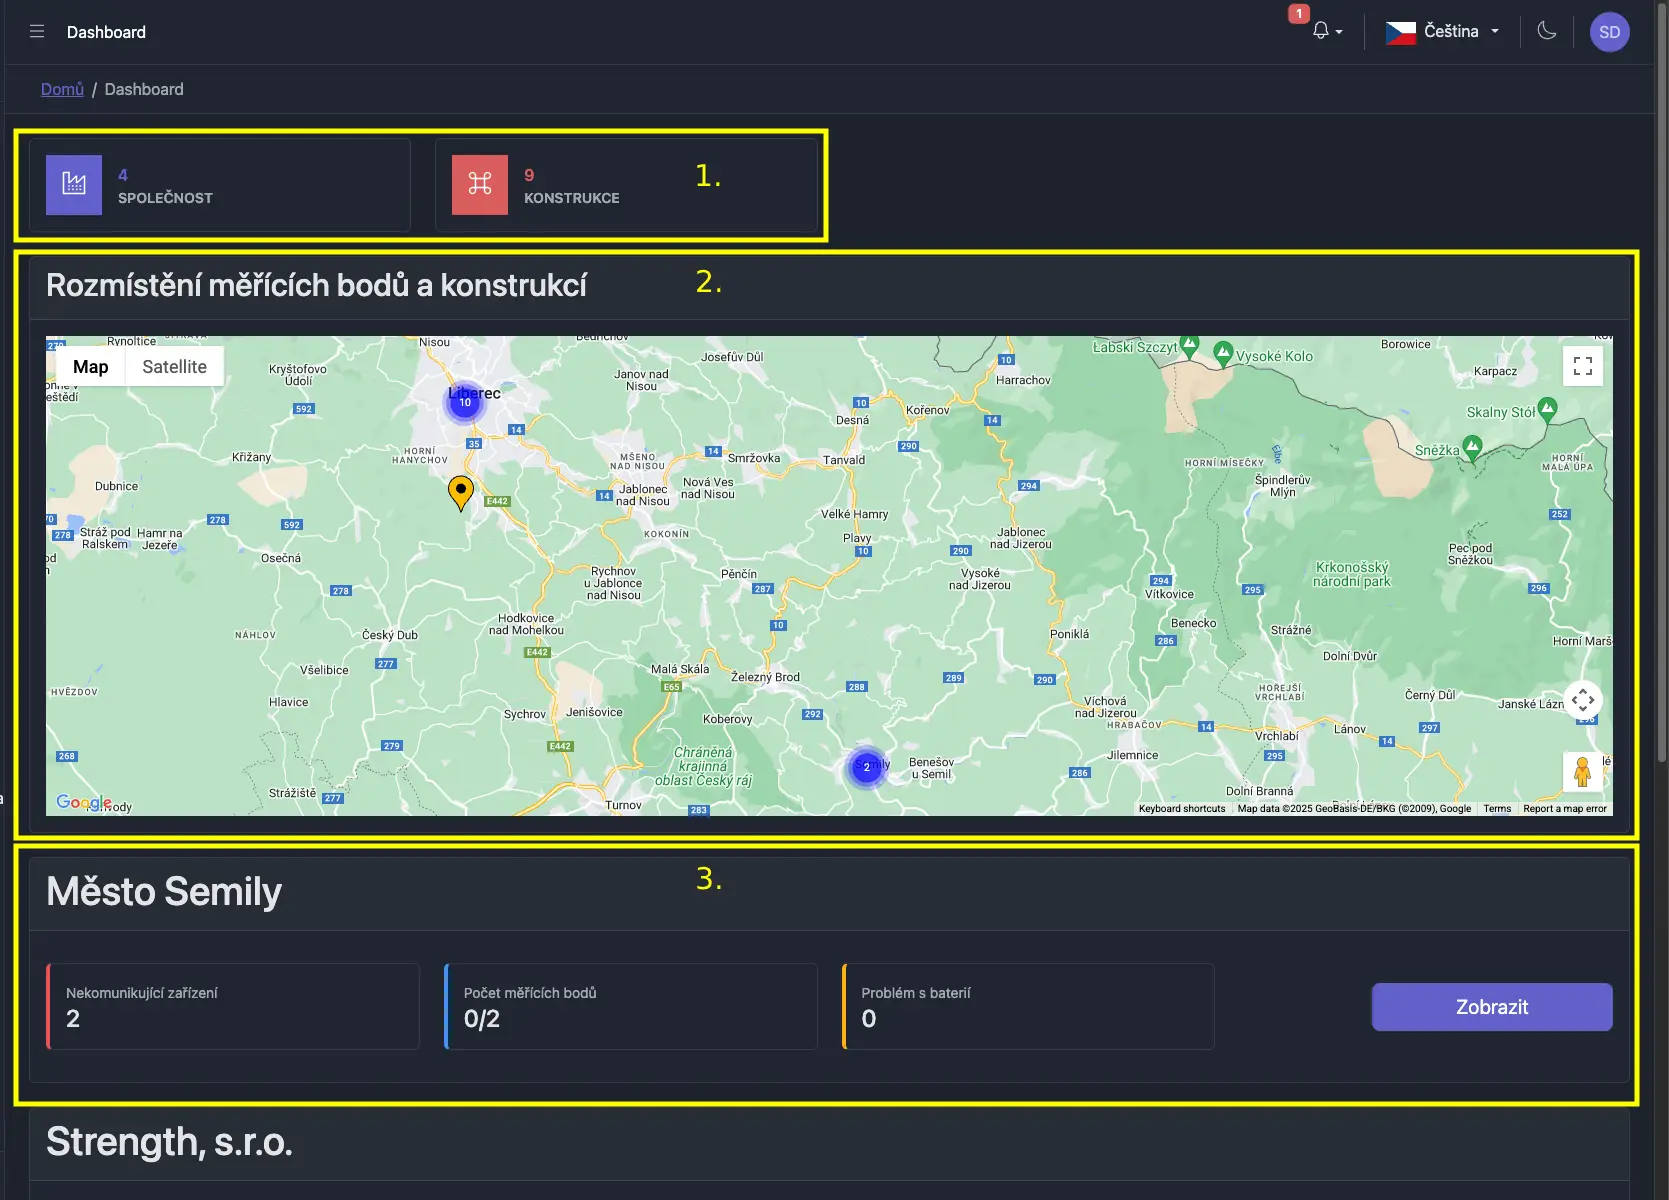
- General statistics
- number of companies the user has access to
- number of structures the user has access to
- map of structures and measurement points
- company cards
- statistics on non-communicating devices (device has not sent data for two days)
- measurement point statistics showing the number of equipped measurement points (have assigned devices) and total number of MPs
- device statistics showing devices that will need battery replacement
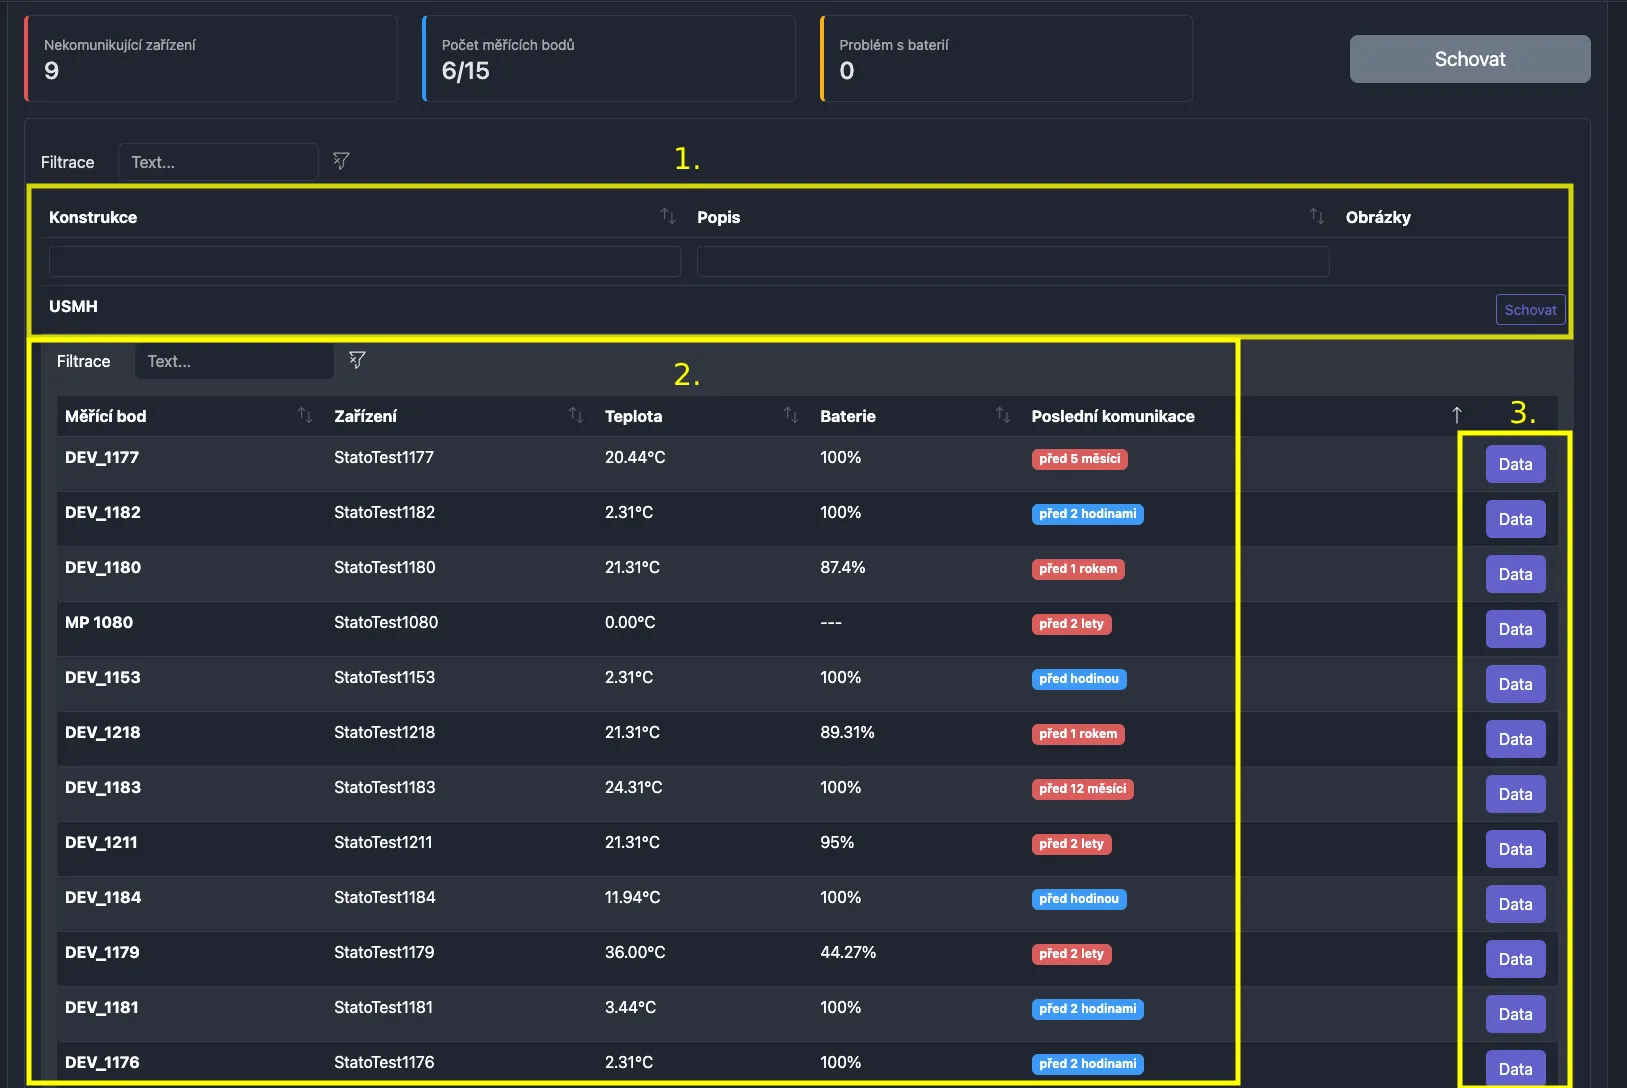
- table of available structures in the given company
- table of measurement points that have assigned devices
- measurement point name
- assigned device name
- last measured temperature
- battery value (if monitored by the device)
- last communication
- redirect to charts with measured data