Introduction
Display of measured values in clear charts that can be individually customized using measurement point parameters.
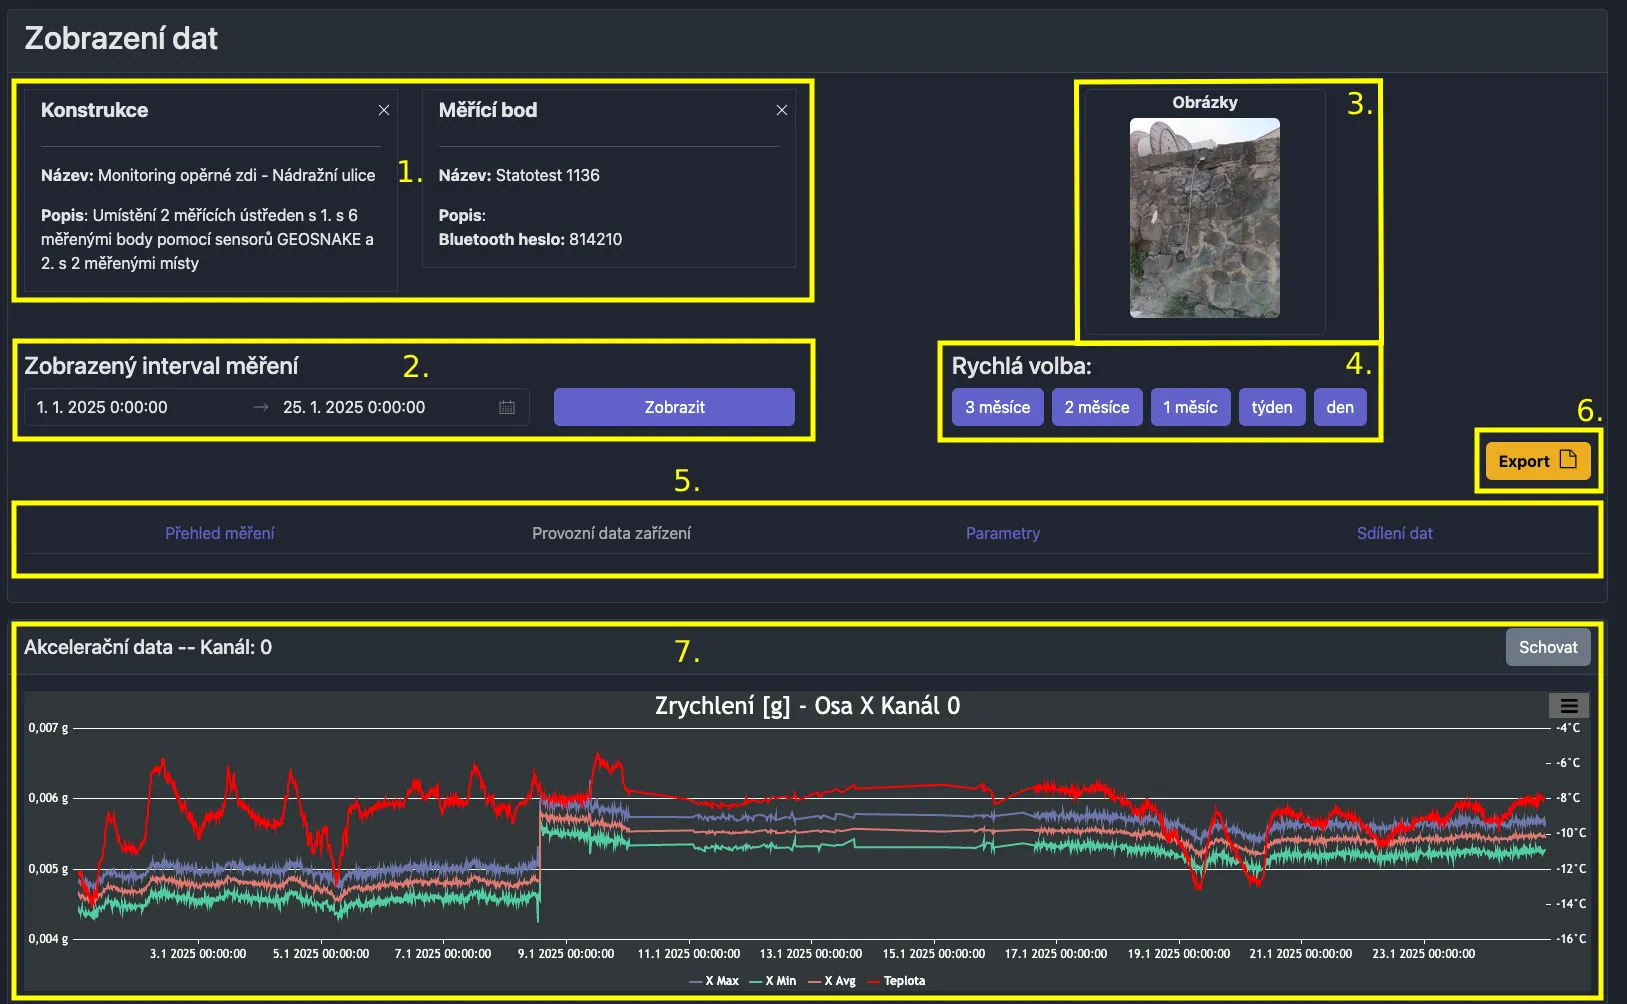
- structure and measurement point information
- name
- description
- additional information
- displayed interval selection
- structure and measurement point images
- diagrams
- location photos
- quick preset for displayed interval
- tabs with additional functions and information
- button for exporting values from charts
- dialog box for selecting data types to be exported
- data is exported directly from charts, so filtering, recalculation, or other modifications of measurement point parameters have been applied
- charts based on data types
- option to hide
Additional Functions and Information
Provided through tabs in the menu located below the interval selection.
Measurement Overview
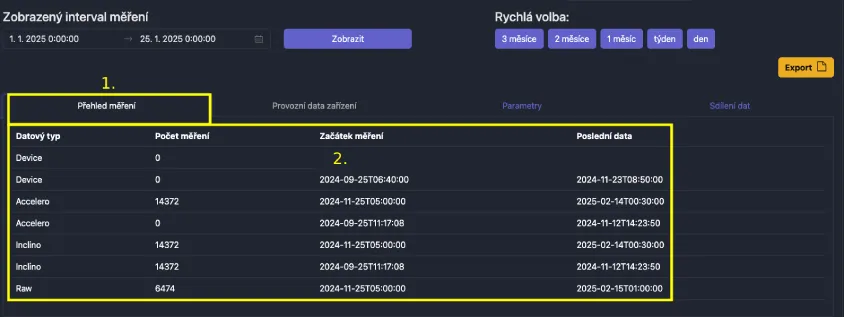
The first tab contains a table with a list of all measured data types that were performed at the given measurement point, together with the date of the first and last measurement.
Device Operational Data
The "Device Operational Data" tab contains charts with values measured by sensors located directly on the device. This usually includes an internal thermometer, hygrometer, and possibly battery percentage status.
Parameters
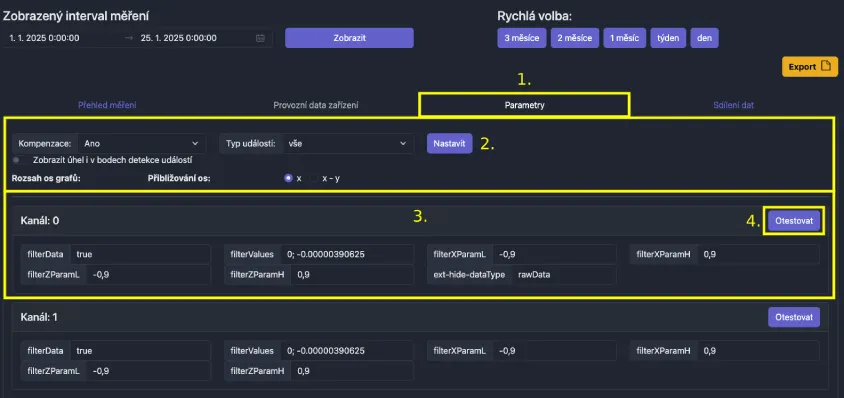
The parameters tab allows testing of various variations and modifications of measurement point parameters. These modify chart names, units, number of decimal places for measured data, filtering and much more.
- generic chart settings
- parameters sorted into measured channels
- button for applying parameters to charts
To apply changed parameters, you must use the "Test" button.
For permanent parameter application, you must use the "Save" button, which is located below the last channel with parameters (see following image).
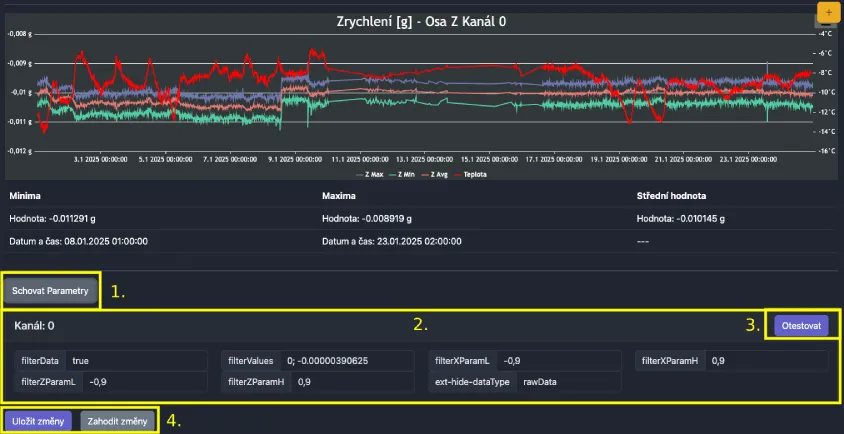
- show/hide parameters under specific charts (data type + measurement channel)
- option to modify parameters
- button for applying parameters to charts
- permanent application of changes (or discard them)
Data Sharing
Used for providing data to persons/systems without needing to log into our portal.
Quick Interval Selection
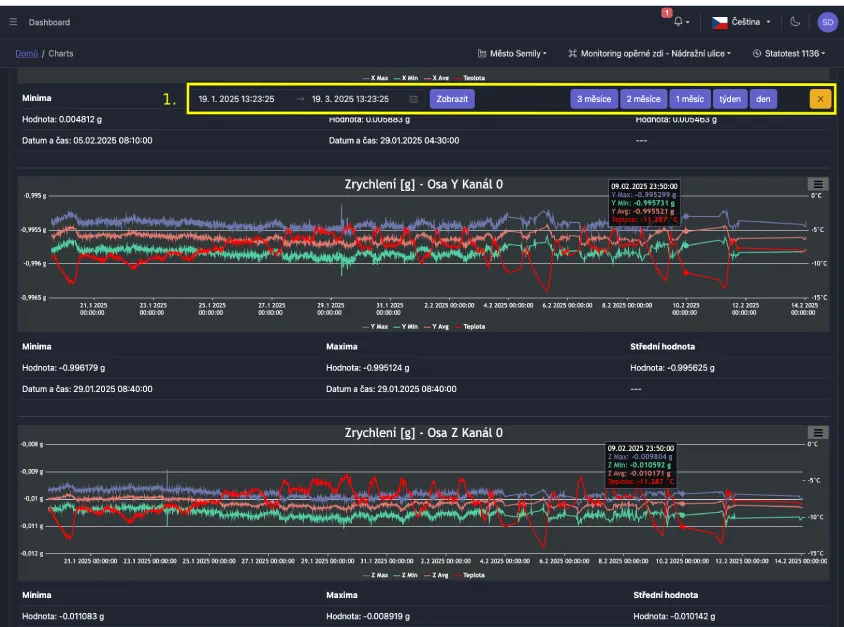
While viewing charts, quick interval selection is always accessible, so you don't need to scroll to the top of the page to change the interval.
The menu can be hidden by clicking the "X" button.