Chart Controls
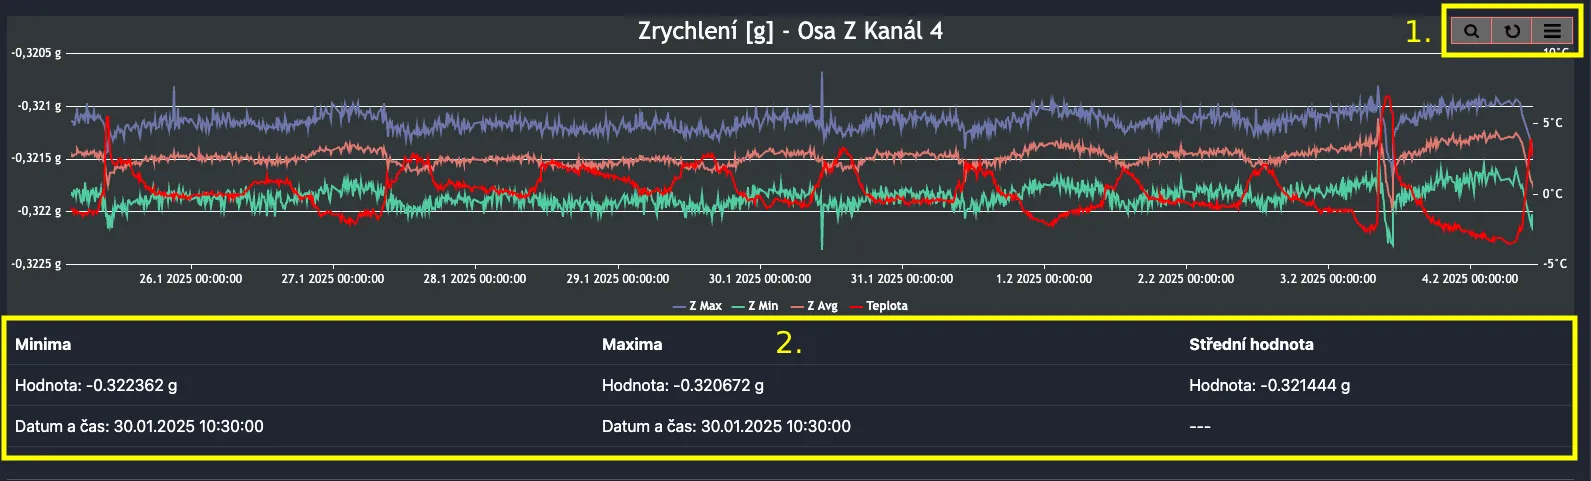
- control elements
- chart navigation
- zoom = select a specific interval to display in the chart
- arrows = move through the chart (left or right)
- return to default chart position (shows all data)
- export options
- print = PDF
- JPG and PNG export the chart image
- chart navigation
- table with statistics derived from the chart
- whether the table is displayed and its values depend on the data type