Working with graphs
The graphs display the measured values in the same way as on our portal, so the same parameters and filtering apply. However, you can set parameters specific only to the mobile app.
Full guide to measurement point parameters...
Display
Graphs are tied to a measurement channel and a data type.
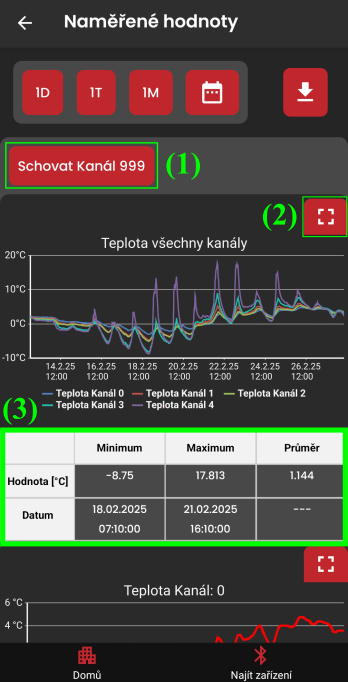
- option to hide the data channel for a given data type (1)
- enlarge the graph to the full width of the screen for a better overview (2)
- graph statistics (3)
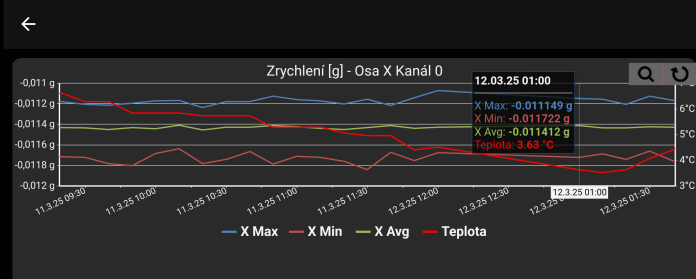
The enlarged graph lets you focus only on a specific section of the data, or pan along the time axis in "zoomed-in" mode.
Where graphs appear in the app
Graphs appear on two screens in the app.
Measurement screen
After connecting to the device via Bluetooth, you can manually start a measurement on the Measurement screen and thus find out the current values.
You can connect to the device on the Find Device screen.
Overview - measured data
The Overview screen lets you display the complete measured data from the device in graphs.