Measurement Screen
It offers the option to manually start measurements, display obtained values in clear graphs, or export them in CSV or JSON format.
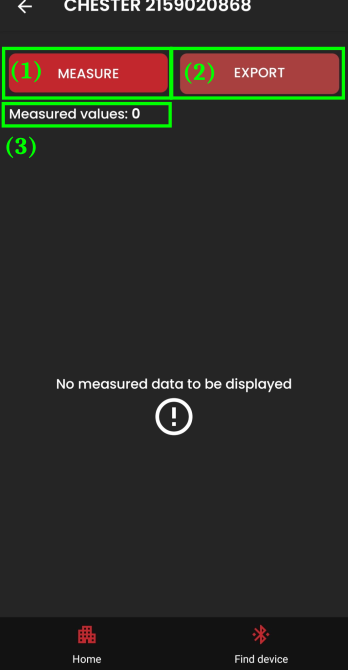
- Button to start measurements (1)
- Button to export measured values (2)
- if no measured values are available, it is deactivated (see example above)
- clicking it opens a dialog window for choosing the export format – CSV or JSON
- Counter of measured values (3)
- the number of measured data in individual graphs
Measuring Data
After receiving measured data, the list of measuring channels is displayed. Each channel, when clicked, displays relevant graphs with measured values.
During repeated measurements, values are gradually added to the graphs.
In the current state, each device has a fixed delay between measurements of 120 seconds.
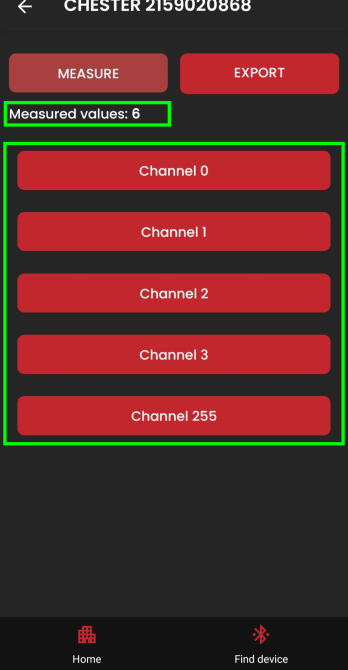
List of channels with measured values
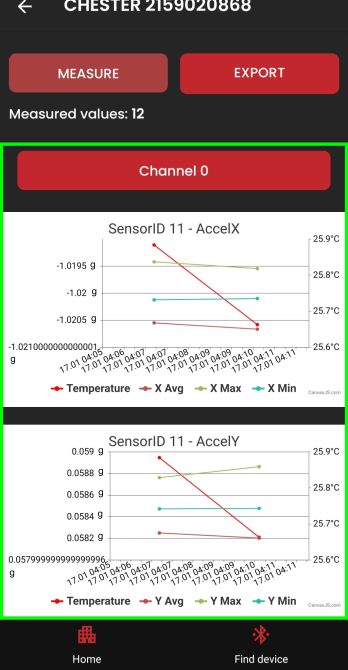
Graph with values (after clicking the channel)
Detailed guide on how to handle graphs...
Exporting Measured Data
You can export measured data with the "EXPORT" button - a dialog for selecting the format in which the data should be exported (CSV, JSON) will appear.
To save the exported file, the application needs to have access to the file system.
It will request permission for it with each attempt to export data (until the user grants permission)
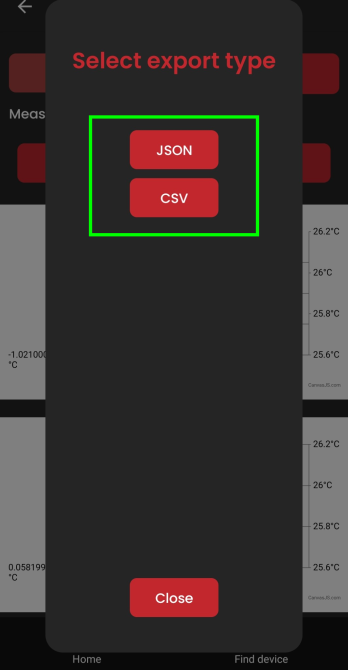
- The file with the selected export format is then saved in the "Downloads" folder on the phone.
- The name of the saved file: Device Name - DD-MM-YYYY hh-mm-ss - export type.txt
- "DD-MM-YYYY hh-mm-ss" corresponds to the date the file was created (DD = day, MM = month, YYYY = year, hh = hour...)
Manual measurement is an excellent way to "instantly" check the latest values on the sensors. Additionally, you can export data and save it for later use - monitoring historical trends.
The next chapter deals with the screen for updating the device firmware.