Handling Graphs
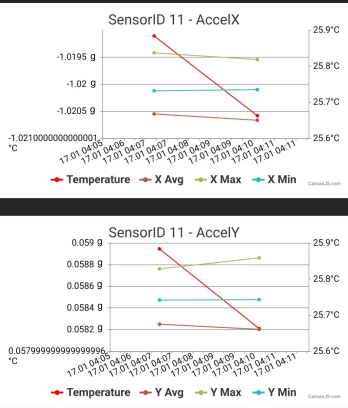
Graphs serve for a clear display of measured values.
Display
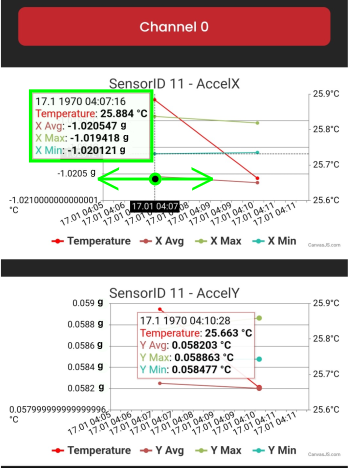
Each graph is associated with a measurement channel where the data was measured - to display them, it is necessary to "click" on the channel.
To find detailed information about measurements (measurement interval, measured value at a specific moment) - drag your finger across the graph (right to left).
Occurrence of Graphs in the Application
Graphs appear on two screens in the application.
Measurement Screen
On the Measurement screen, you can manually start measurements and find current values.
The application must be connected to the device via Bluetooth.
Device Information - Measured Data
On the Device Information screen, you can view measured data within the last 24 hours.