Viewing Data
This page explains the charts and movement visualization you see after loading data.
Prerequisites
- Organization, Construction, Measurement Point selected
- Data loaded via the View button

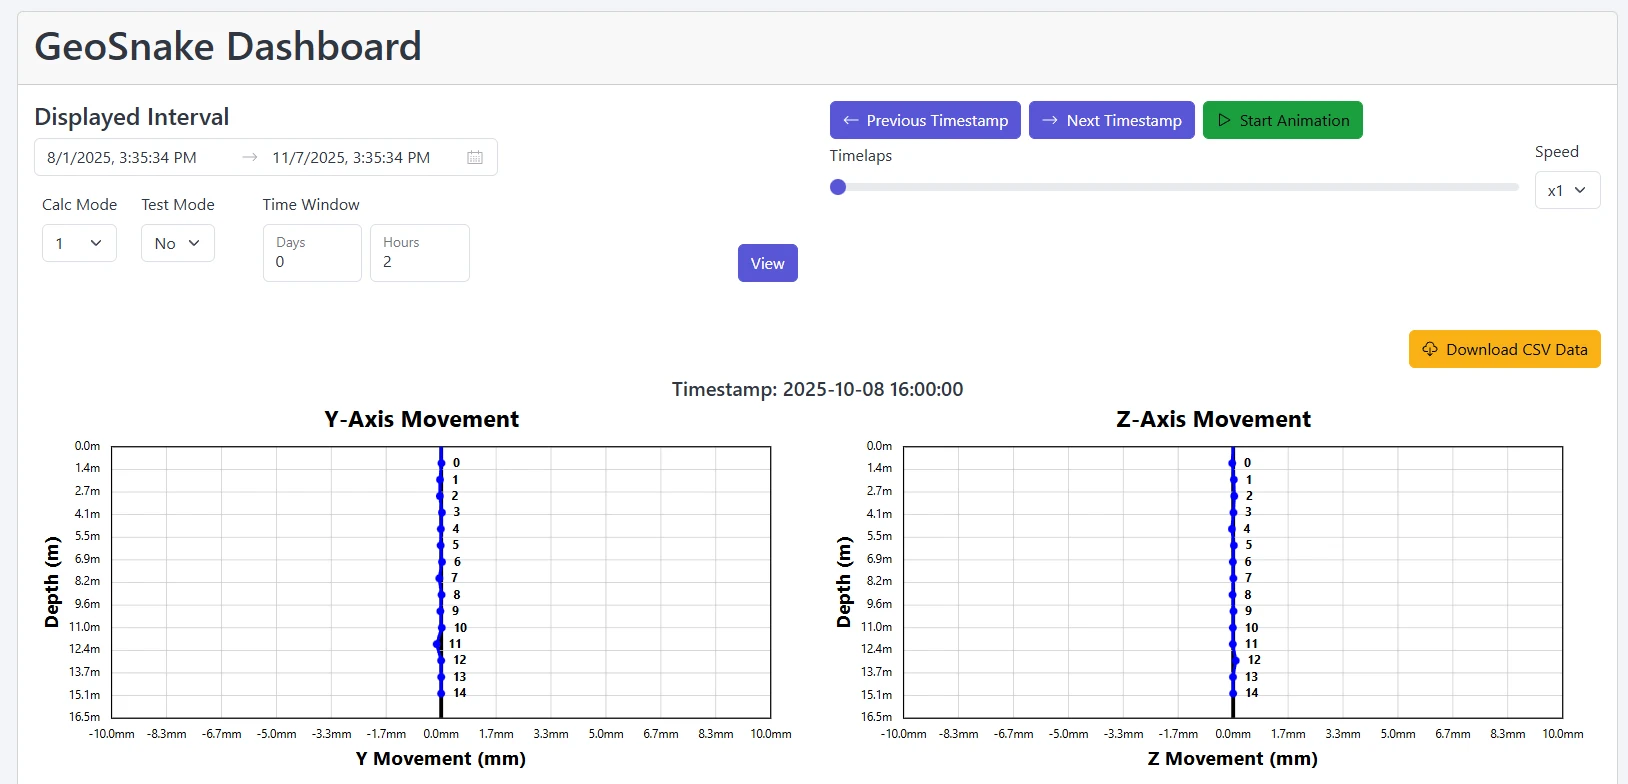
Timestamp banner
A timestamp header displays the currently selected frame time in YYYY-MM-DD HH:mm:ss.
Charts
Two charts are shown per frame:
- X-Depth Chart – lateral movement along the Y axis vs depth
- Z-Depth Chart – lateral movement along the Z axis vs depth
Each chart contains:
- Segment lines connecting sequential segments
- Colored points for each segment position at the frame timestamp
- Segment labels (segment order)
- Gridded depth axis (meters)
- Centered movement axis (millimeters) with zero in the middle
Color meaning:
- Blue – segment has a sensor and measurement at current timestamp
- Red – segment has a sensor but no measurement at this timestamp (position carried forward)
- Grey – segment without a sensor (structural placeholder)
Units
Depth (vertical axis) is in meters. Lateral movement axes (horizontal movement in X and Z charts) are in millimeters.
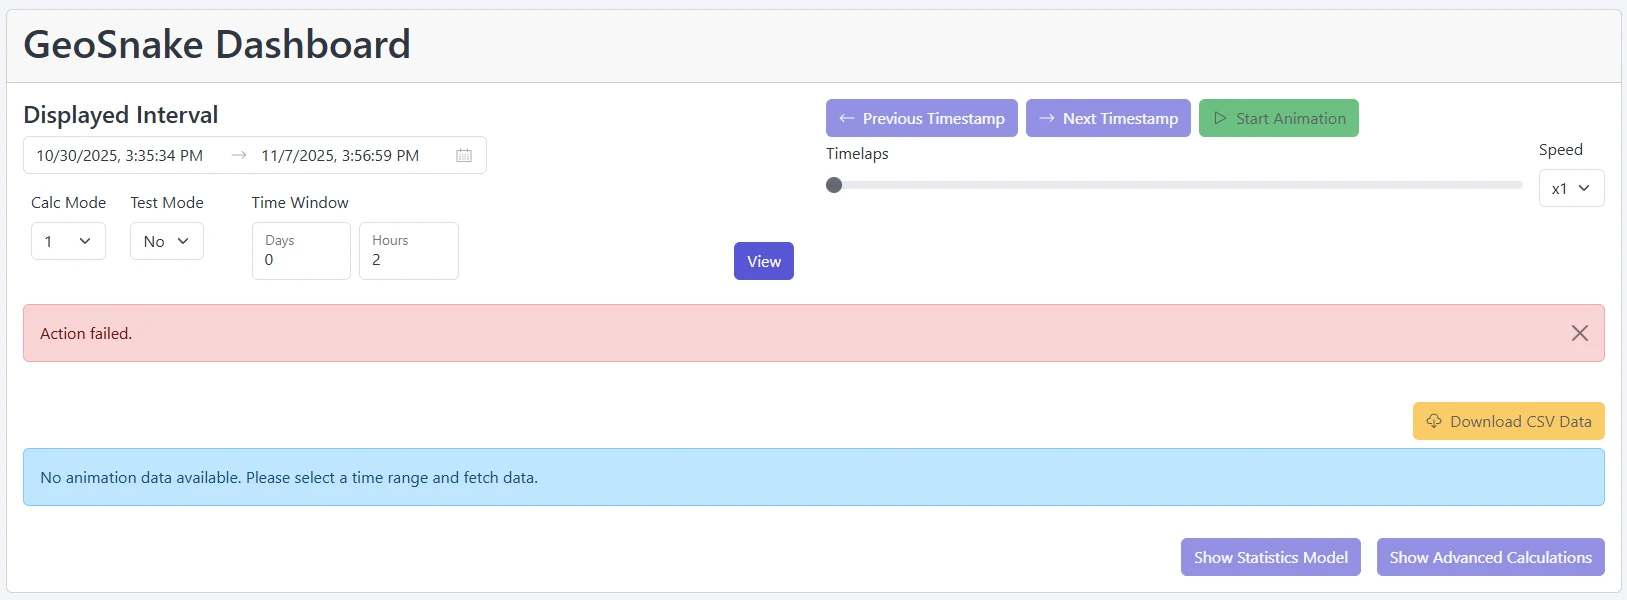
No data state
If there are no frames for the selected interval, an informational alert is displayed:

Navigating frames
Use the Animation Control (see separate doc) to move through frames or play an auto-loop. When auto-looping is active, tooltips are disabled for performance.
Top View (future)
A top view (X vs Z plane) is planned but currently not displayed. It will provide a horizontal projection of movement.