Markers
Annotate chart data with named markers to record events, conditions, or observations directly on the timeline — visible across all charts for the selected Measurement Point.
Before you begin
Select an Organization, Construction, and Measurement Point. The Markers tab is visible to all roles; management actions require Construction Admin or higher.
| Action | Minimum role |
|---|---|
| View markers and occurrences | All roles |
| Toggle markers display in charts | All roles |
| Create / edit / delete company marker | Construction Admin |
| Assign a marker | Construction Admin |
| Edit / delete an occurrence | Construction Admin |
| Create / edit / delete global marker | Global Admin |
Panel overview
The tab contains three areas:
- Action bar — buttons for marking mode and creating a new marker, plus the Show markers in charts toggle
- Filter bar — scope buttons (All / Global / Company) and an optional category dropdown
- Marker cards — one card per marker, each with a list of its occurrences in the current interval
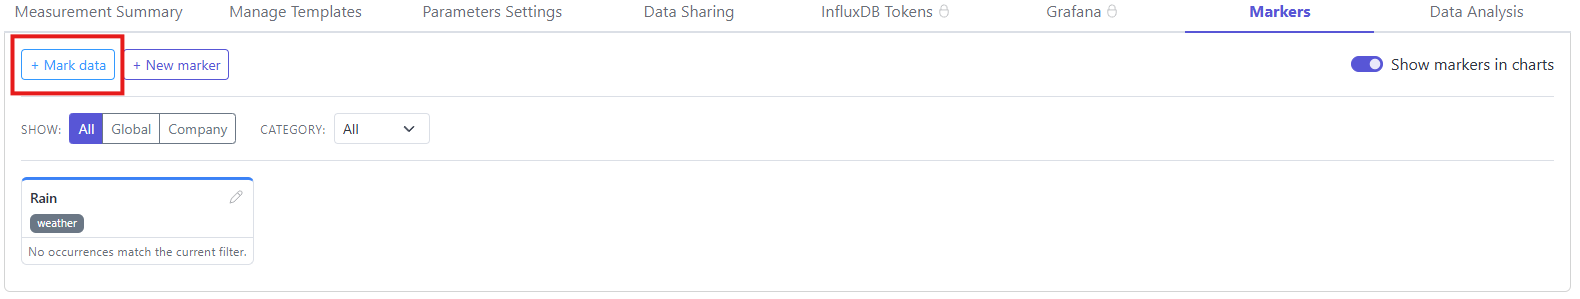
Show markers in charts
The toggle in the top-right corner controls whether markers appear as lines and regions in the chart plots. It is on by default. Turning it off hides all visual annotations without removing any data.
Managing markers
A marker is a reusable label — a name, optional category, and color. You create it once and then attach it to any number of points or intervals on the timeline (called occurrences).
Marker scope
| Scope | Who creates it | Who sees it |
|---|---|---|
| Company | Construction Admin for your company | Users within your company only |
| Global | Global Admin | All companies on the platform |
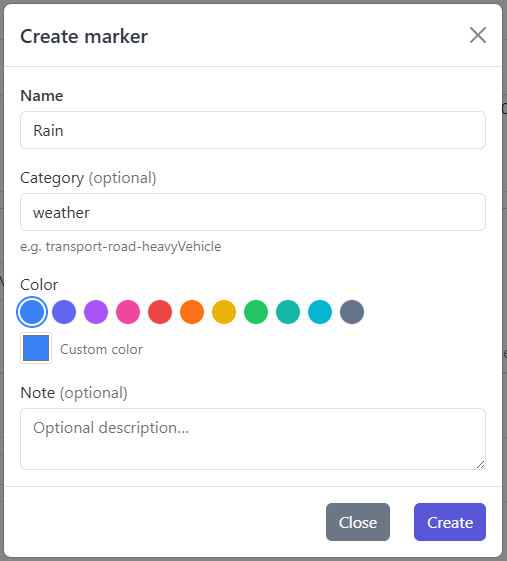
Creating a marker
Click + New marker to open the creation form.
| Field | Required | Notes |
|---|---|---|
| Name | Yes | Displayed in the panel and chart tooltips |
| Category | No | Hierarchical slug, e.g. transport-road-heavyVehicle. Levels separated by dashes. Used for filtering. |
| Color | Yes | Choose from the palette or enter a custom hex value |
| Description | No | Optional text shown in the marker detail |
Editing and deleting a marker
In the marker card header, click the edit icon (pencil) to open the edit form. Changes to name, color, category, or description take effect immediately for all occurrences of that marker.
To delete a marker, use the delete option inside the edit form. Deleting a marker permanently removes all its occurrences.
Marking mode
Marking mode lets you attach markers to specific moments or intervals in the chart.
Enabling marking mode
Click + Mark data in the action bar. The button turns red and a marking overlay is placed over the charts. Click the button again or press Esc to exit.
Placing a point marker
Click anywhere in the chart. The click snaps to the nearest measured data point. The Mark data dialog opens.
A point marker appears as a dashed vertical line in the chart.
Placing a range marker
Click and drag across a time interval in the chart. A selection rectangle with start and end timestamps appears while dragging. Release to open the Mark data dialog.
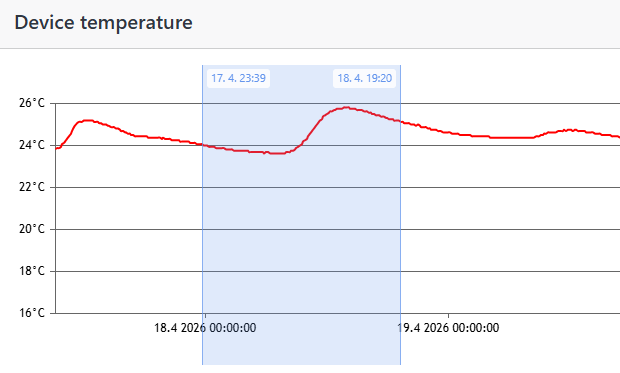
A range marker appears as a filled, semi-transparent region in the chart.
Mark data dialog
After placing a point or range in the chart, the Mark data dialog opens.
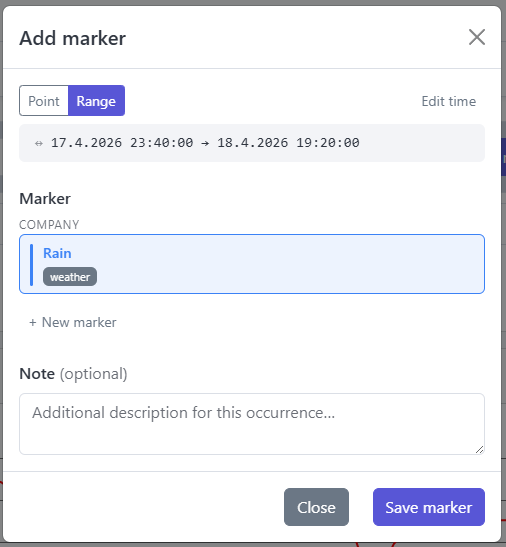
- Point / Range toggle — switch the occurrence type before confirming
- Edit time — fine-tune the timestamp or range boundaries
- Marker — select from the list of available markers; use + New marker to create one on the spot
- Note — optional free-text note attached to this specific occurrence
- Ignore data (range markers only) — marks this time range so its data is excluded from calculations. Use this when the data in the range is not valid for analysis — for example during sensor recalibration or a known measurement disruption.
Click Mark to save.
Range markers record statistics (min / avg / max) for each data type within the selected interval at the moment of saving. These are stored with the occurrence and shown in the chart tooltip.
Occurrences
Each time a marker is assigned to a point or interval, an occurrence is created. Occurrences are listed inside their marker's card, showing the timestamp (point) or time range (range).
Only occurrences that fall within the currently selected display interval are shown.
Filtering
- Scope — show All, Global-only, or Company-only markers
- Category — visible when categories exist; filters by the root level of the category slug (e.g. selecting transport shows all transport sub-categories)
- Individual marker visibility can be toggled by clicking its card header
Zooming to an occurrence
Click any occurrence row in the panel to zoom all charts to that event:
- Point marker — zooms to ±1 hour around the point
- Range marker — zooms to the exact start–end range
Editing an occurrence
Click the edit icon next to an occurrence to open the edit form. You can adjust the time, switch between point and range type, and add or update a note. For range occurrences, statistics are automatically recalculated from the current chart data on save.
Clicking a marker in the chart
Clicking a marker line or region directly in the chart opens a detail tooltip.
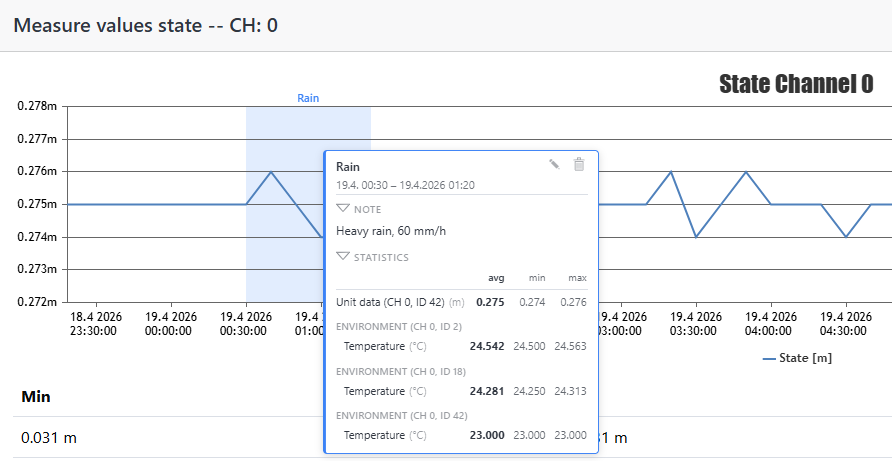
The tooltip shows:
- Marker name and time (point: timestamp, range: from → to)
- User note (if set)
- Recorded statistics in JSON format — avg / min / max per data type (range markers only)
- Edit and Delete buttons (Construction Admin and above)
Deleting an occurrence
Use the delete icon in the occurrence row in the panel, or the delete button in the chart tooltip. This removes only the occurrence, not the marker definition itself.
Related
- Markers Overview — browse all marker occurrences across every Measurement Point in your organization